- Digital Marking System for CBSE
- +91 9229113533
- +91 9229113566
- info@addmengroup.com
- Send Query
- Available as OEM on GeM
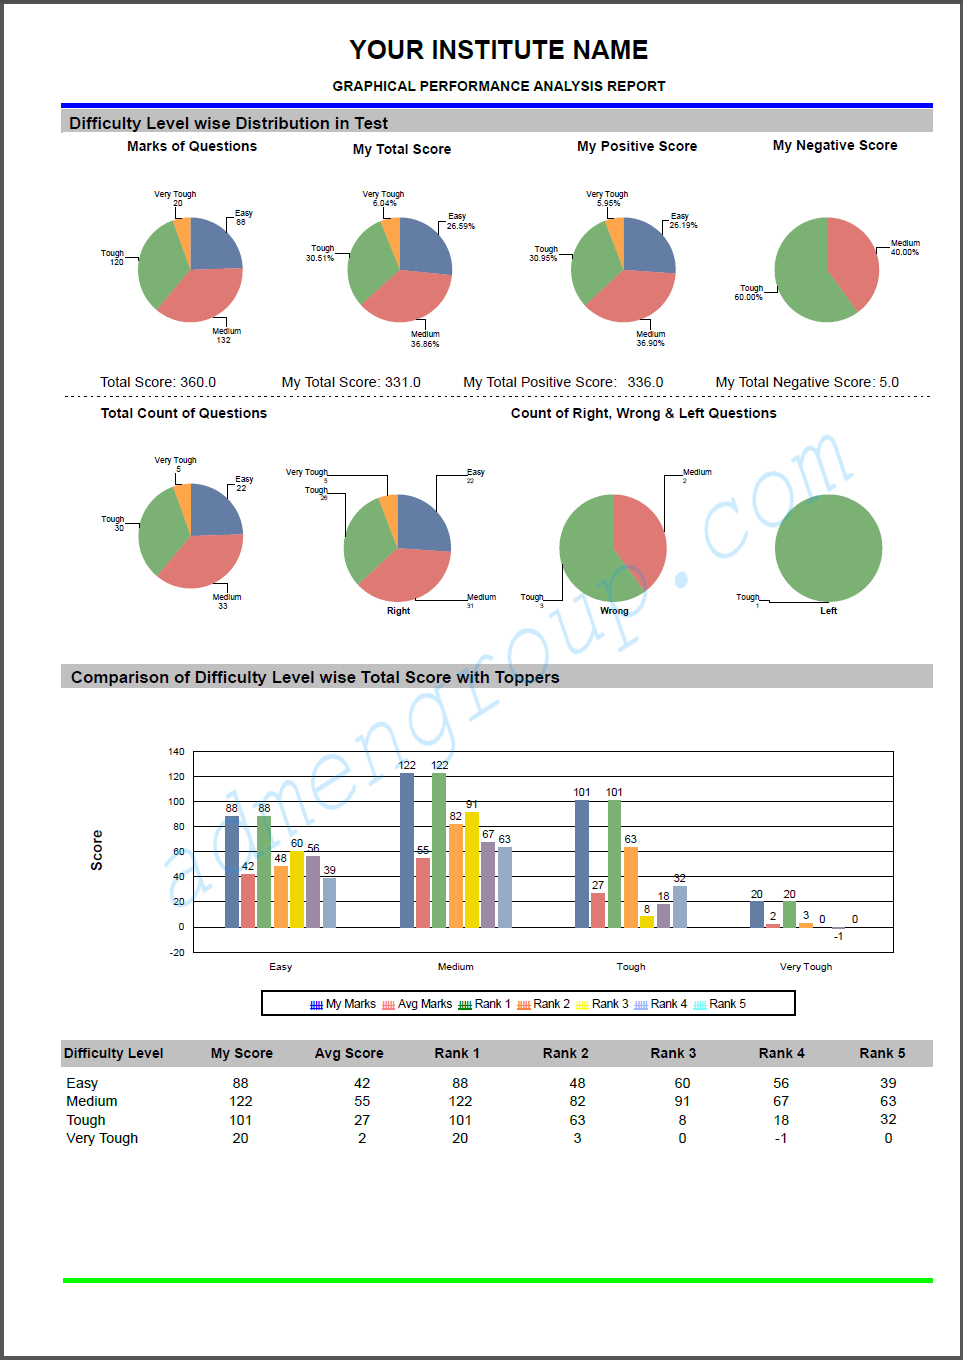
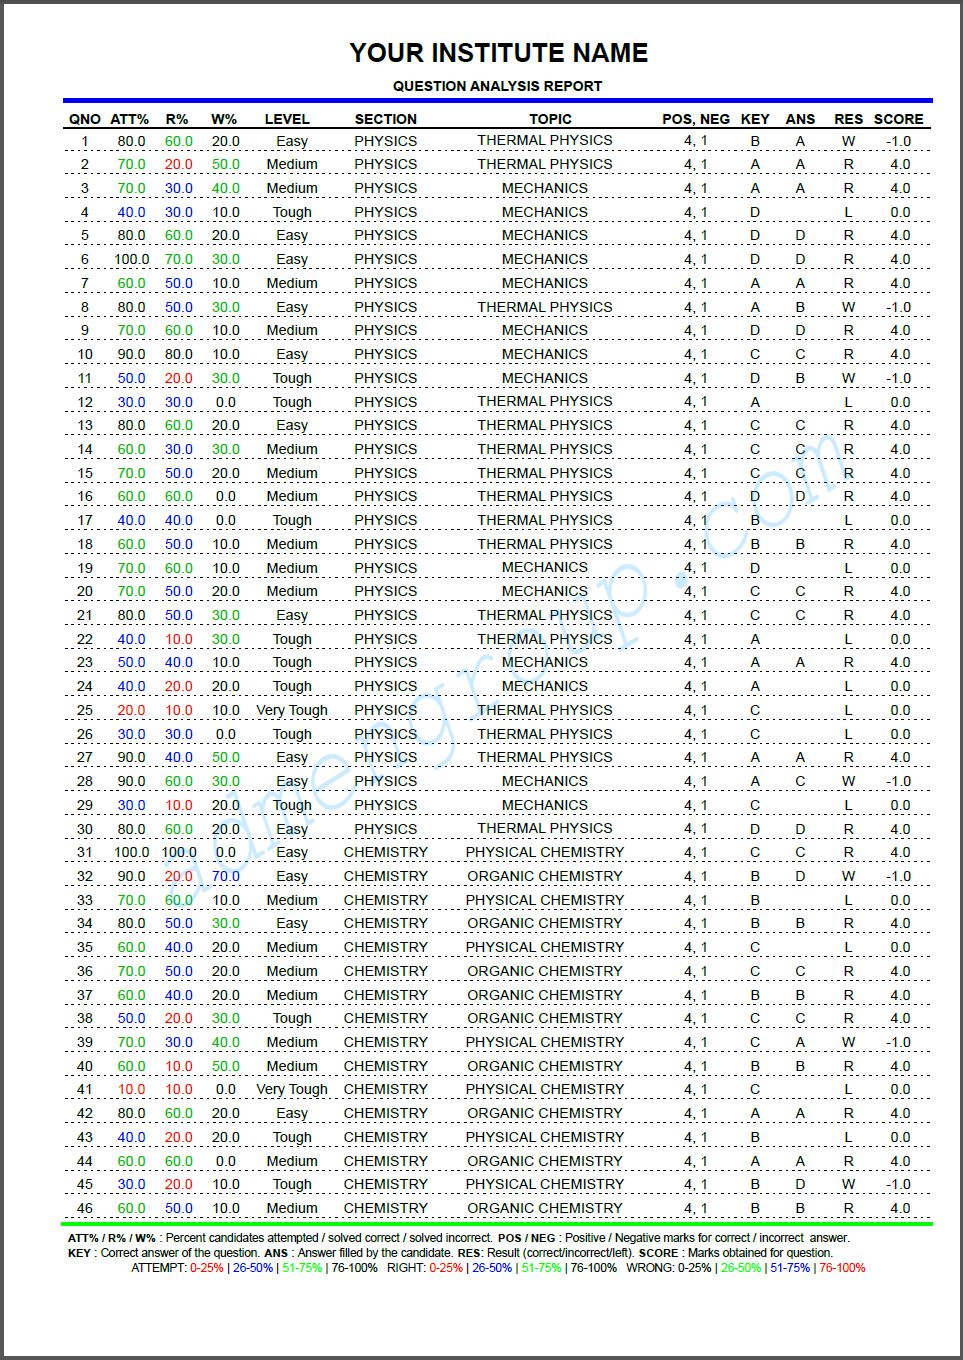
The Addmen OMR software is mainly known for its ability of reading and evaluating OMR sheets. However, these are not its only talents. The OMR software can generate reports after evaluating test papers and exam sheets. Not only that, you can choose to create different types of reports with the help of this software. Apart from mark lists, tabular mark sheets, etc., it is also possible to create graphical performance reports.
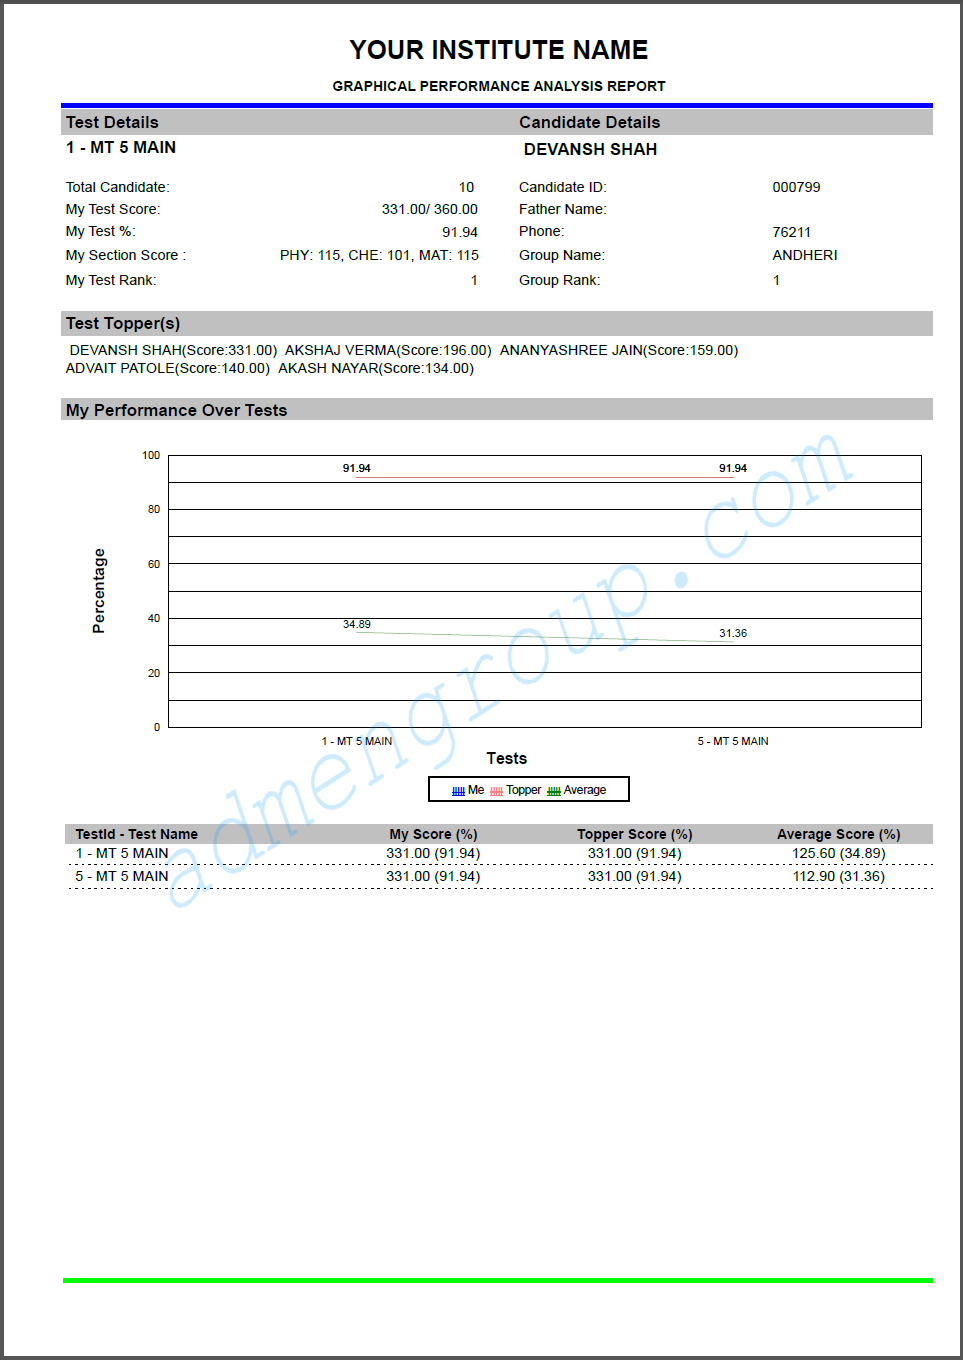
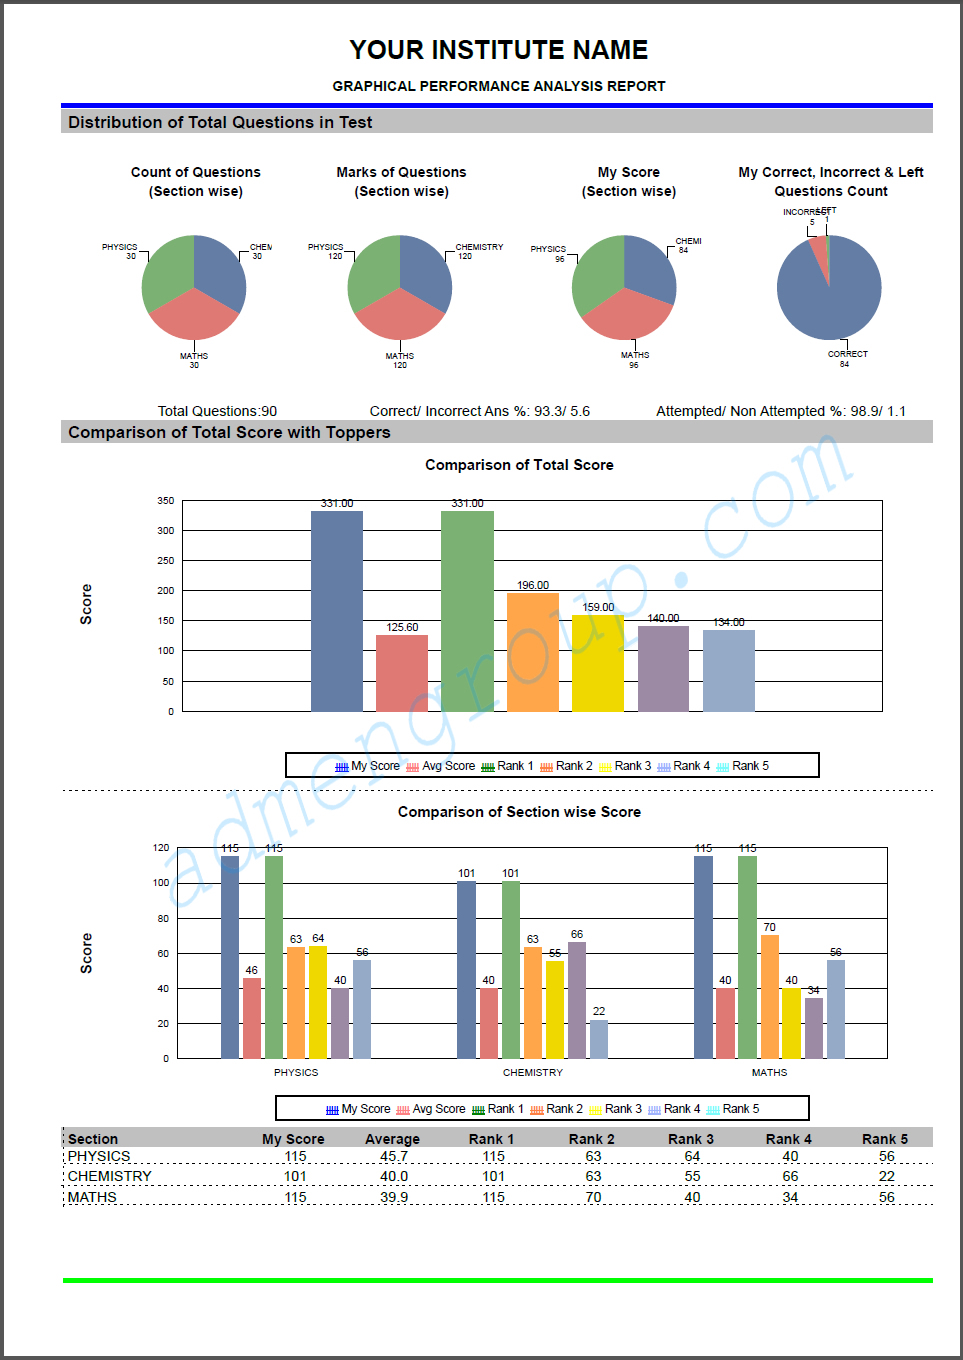
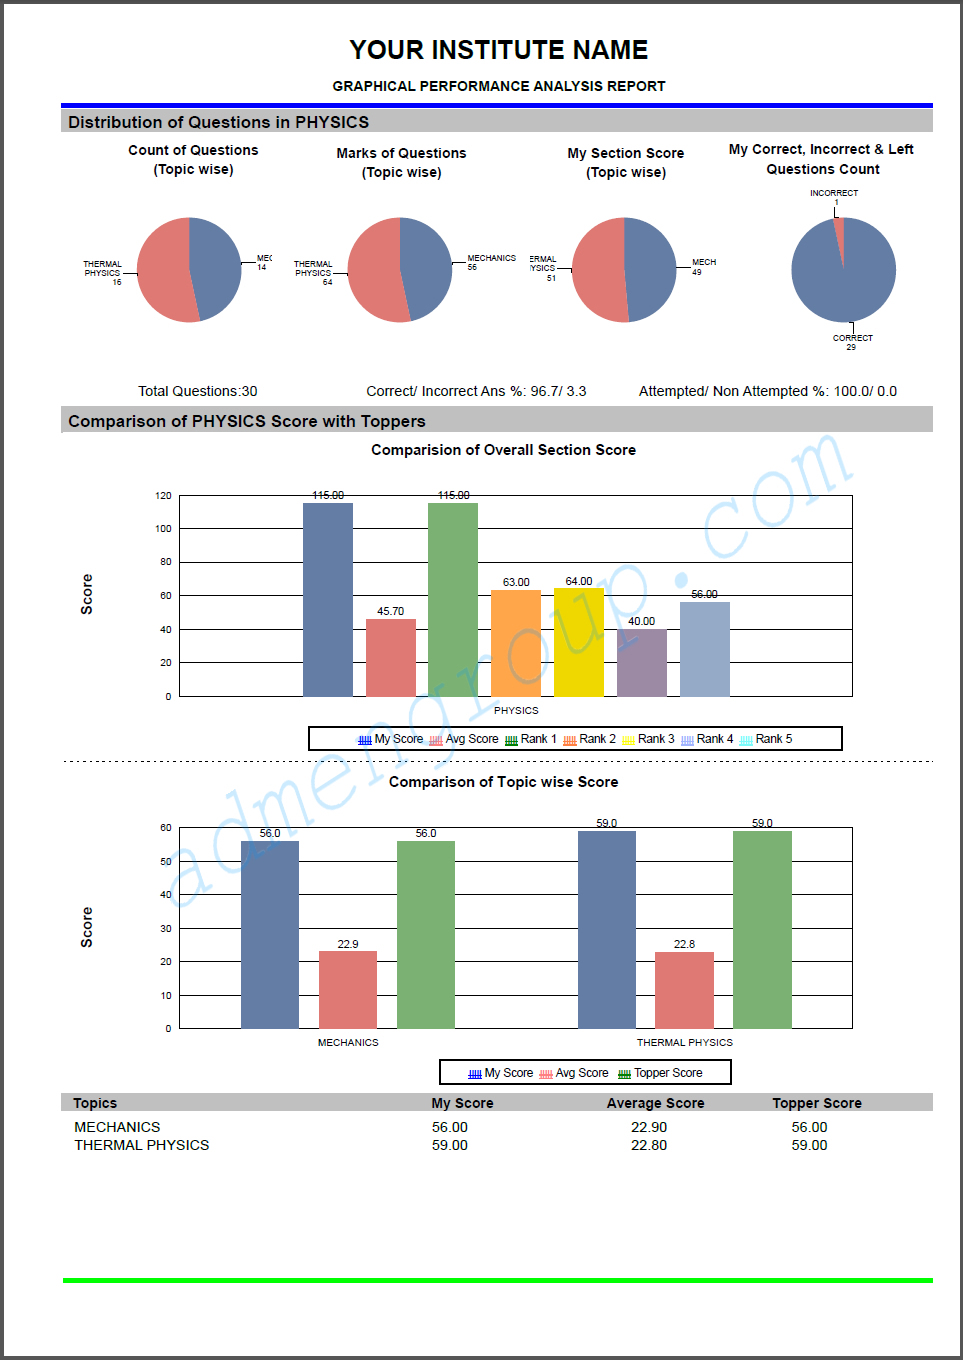
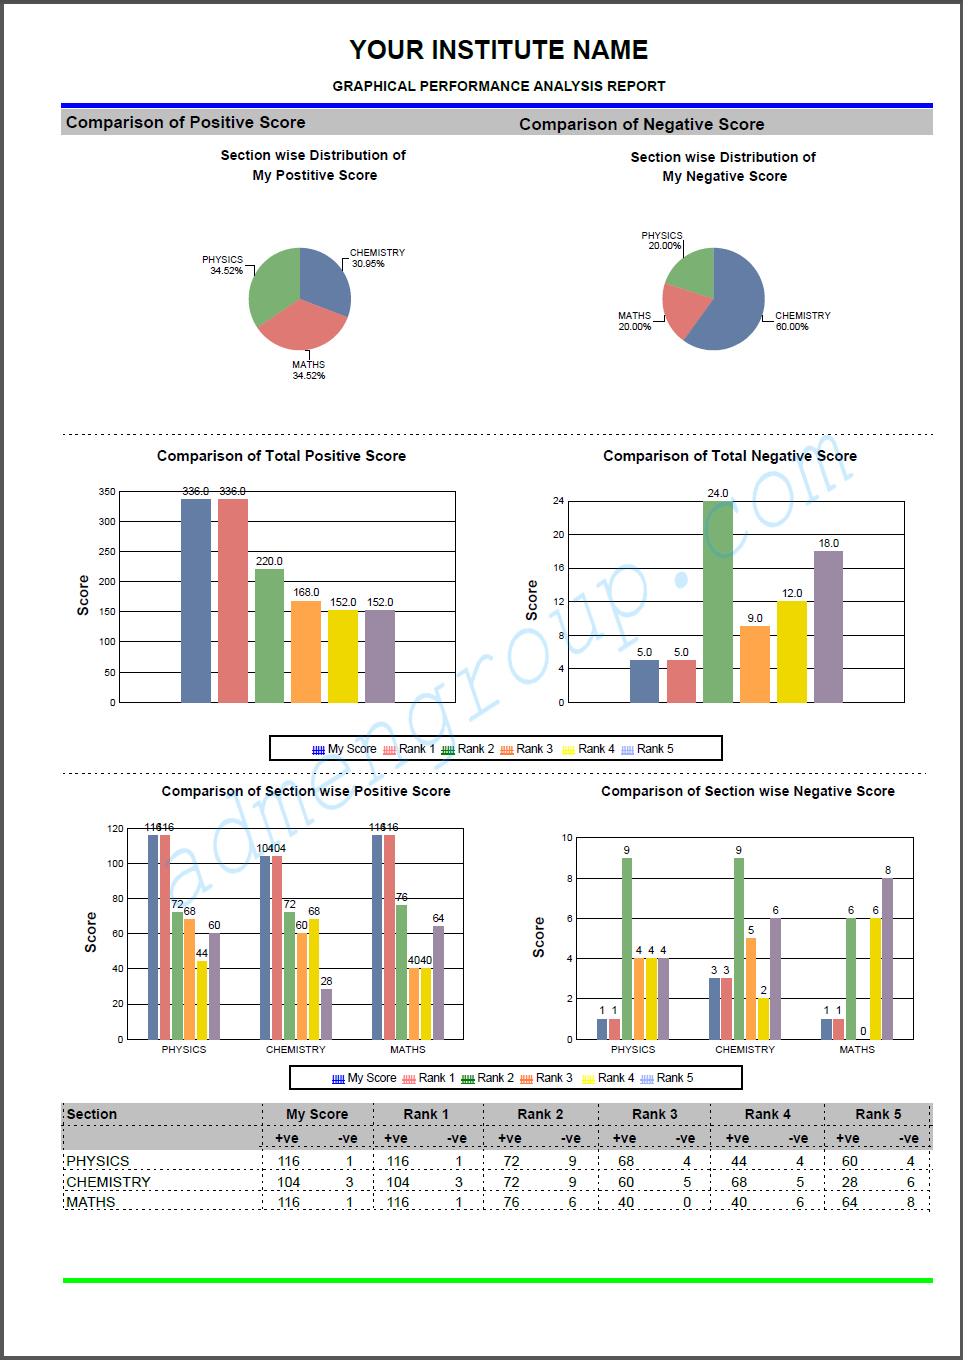
The graphical performance reports are available in different forms. One of the most basic and most commonly used forms is the overall performance report. This test report shows the overall marks scored by the student in the entire test series. Here, we have presented a graphical performance report of the overall performance of the students for your reference.
The report begins with the test details on the left-hand side and candidate details on the right.
Test details include name of the exam, total number of candidates who appeared for the exam, test score, test percentage, section-wise scores and test rank.
Candidate details include name of the candidate, his/her ID, father's name, phone number, group name and group rank.
The next section is where the names and scores of top five scorers are displayed.
The graphical representation of the scores begins after this. The first section consists of a line graph that shows the candidate's performance in tests in comparison with the top score and the average score.
The scores and percentage are given below in table format too. The candidate's marks are shown in blue, top marks in red and average marks in green.
Graphical reports not only show the marks received by the students but also tell where the student stands in his/her class. Moreover, teachers do not have to spend any time in creating such reports. Once the marks are uploaded on the OMR software, it creates these reports within minutes.
      |
| Download Full Graphical Performance Report PDF |
About OMR Sheets
OMR Design & Print
OMR Sheet Scanning
OMR Reading & Checking
Result & Output