- OMR+ICR Software for CBSE 2021
- +91 9229113533
- +91 9229113566
- info@addmengroup.com
- Send Query
- Available as OEM on GeM
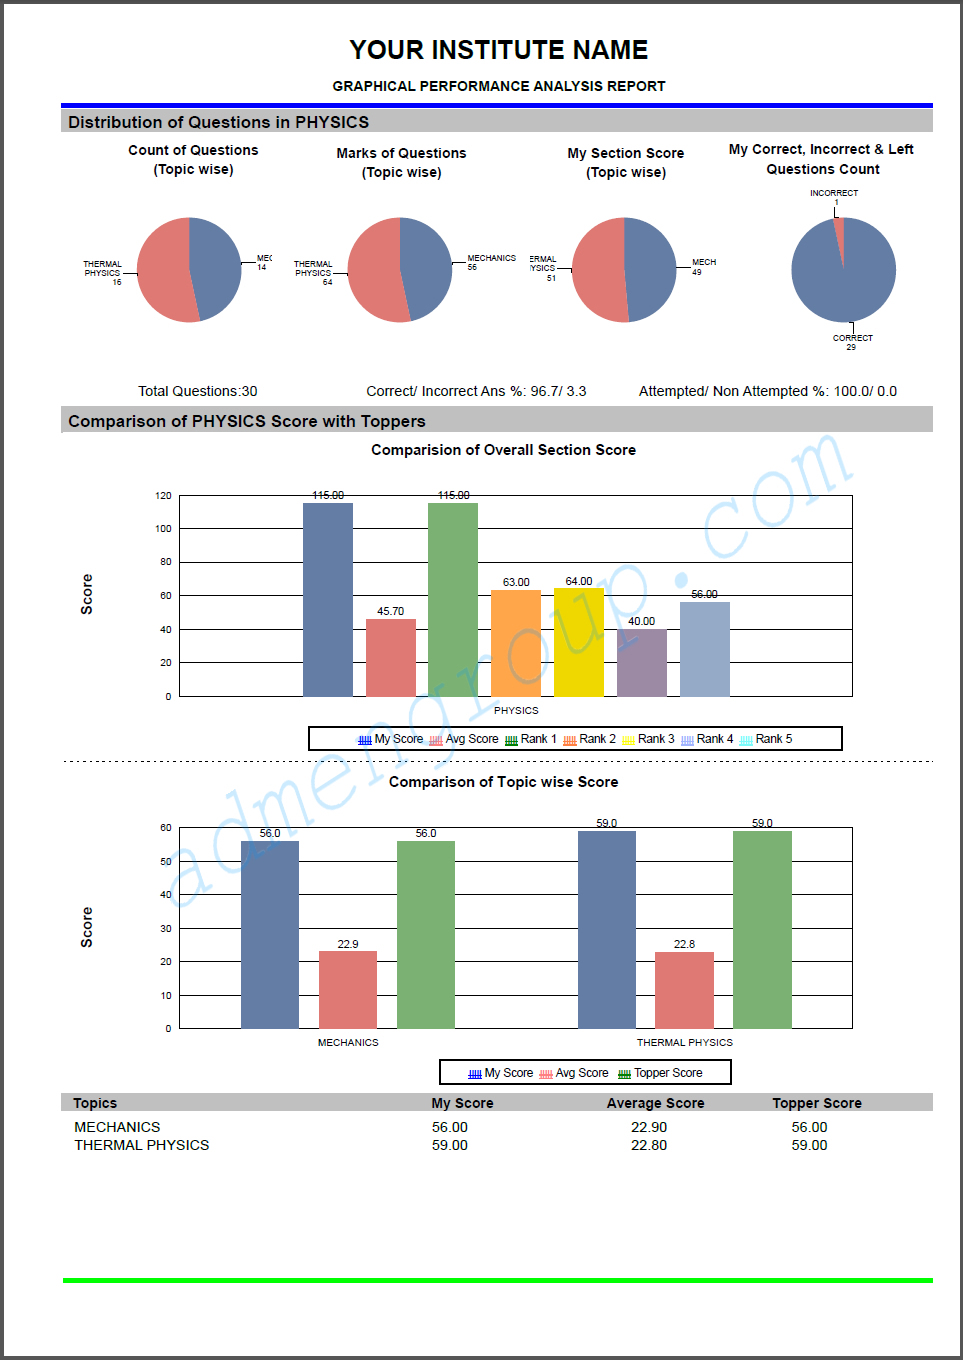
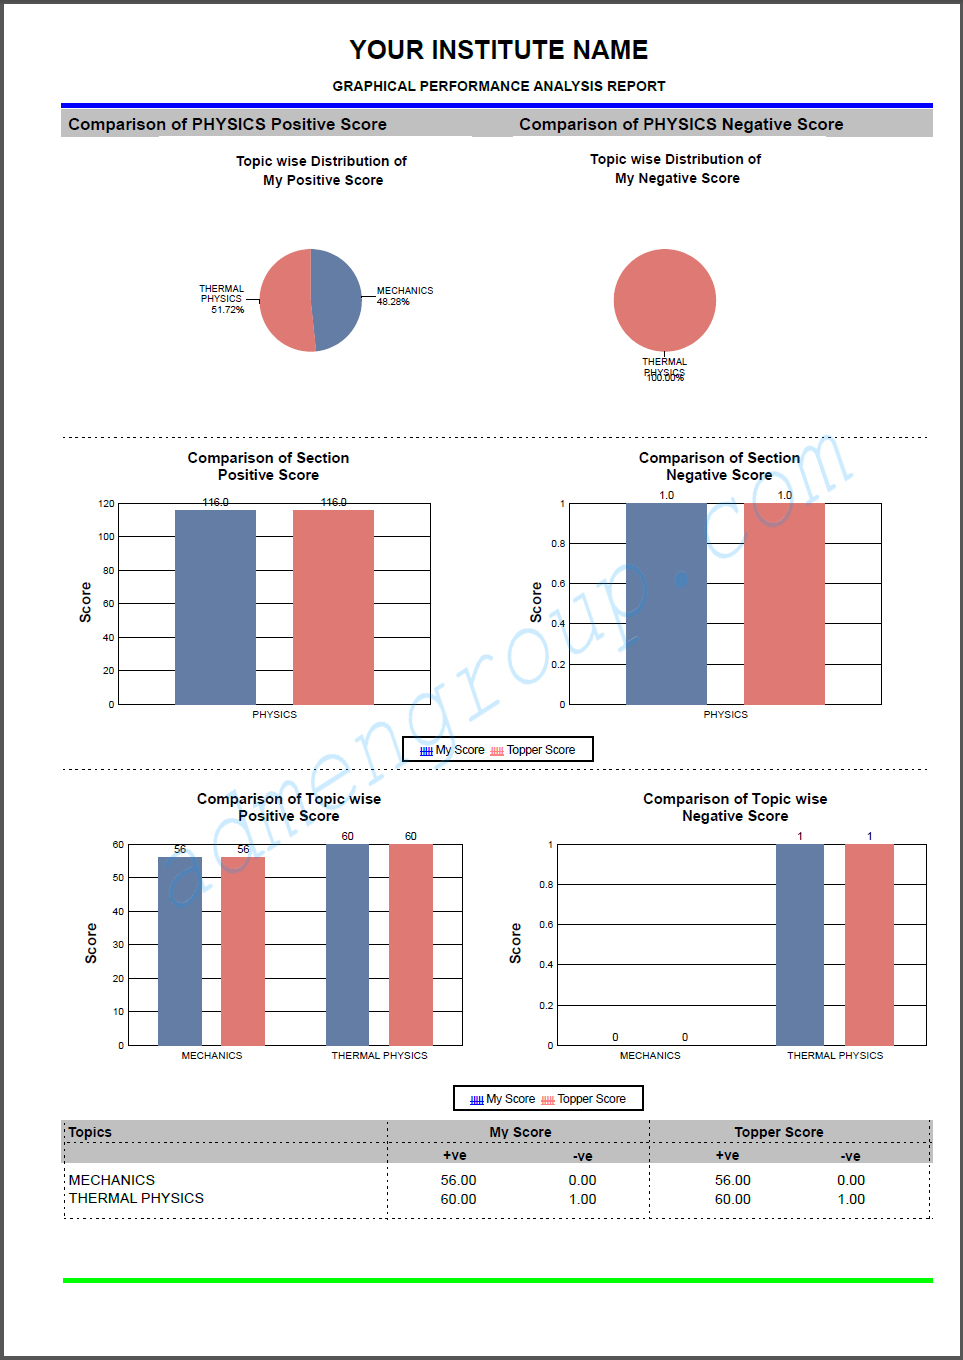
All test results can be displayed in tabular as well as graphical formats. Understanding a result in text form might be an inconvenience to some. The most efficient and common way of analyse the overall performance of a candidate or a group of candidate is by mode of graphical illustration. You can view the results in different types of Graphical formats; the commonly used ones are line graph, bar graph, and pie chart.
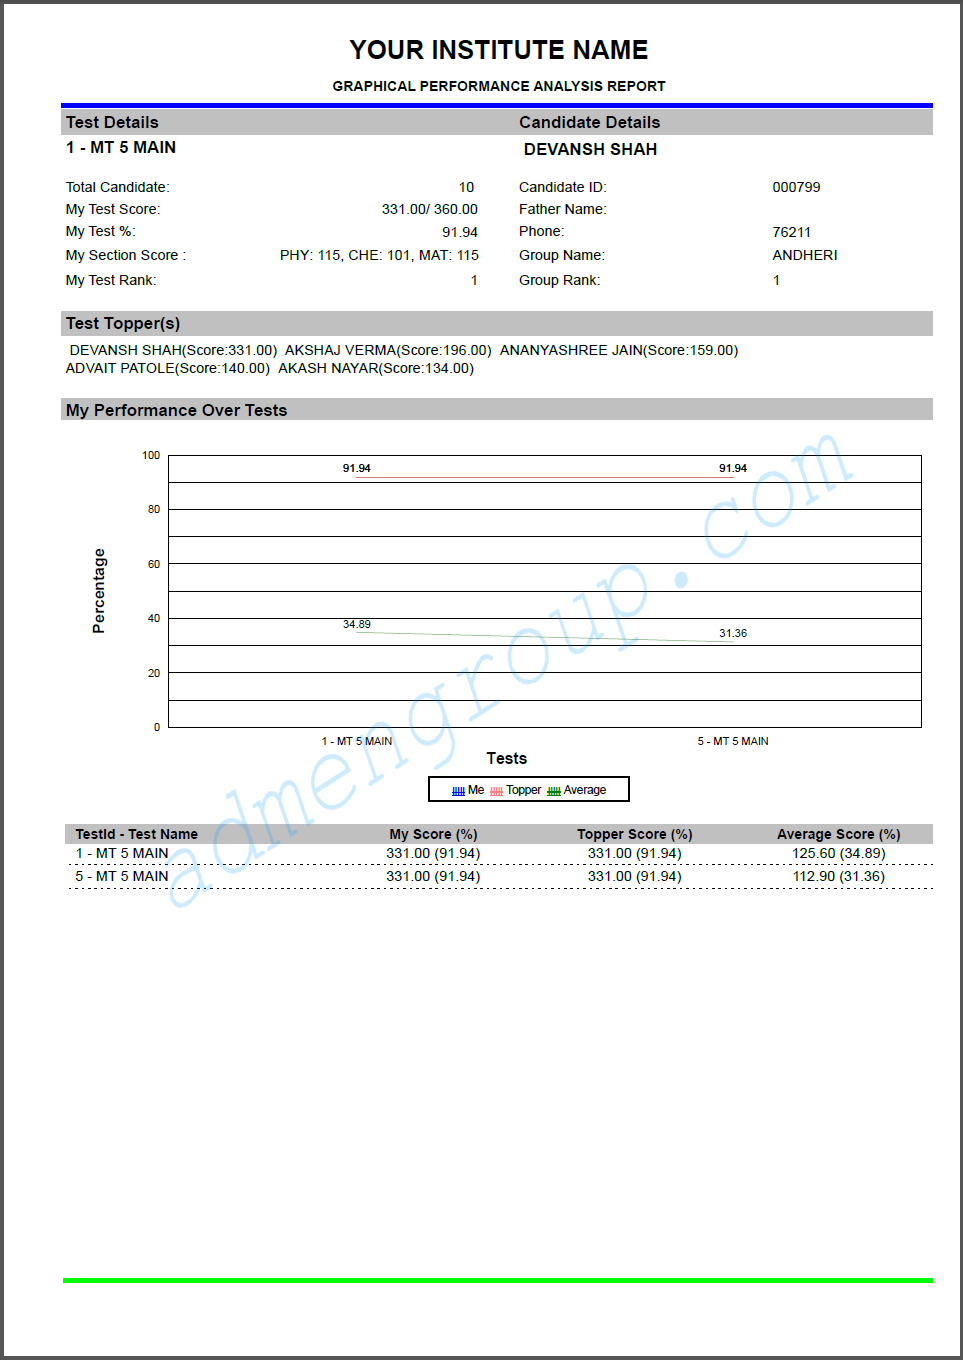
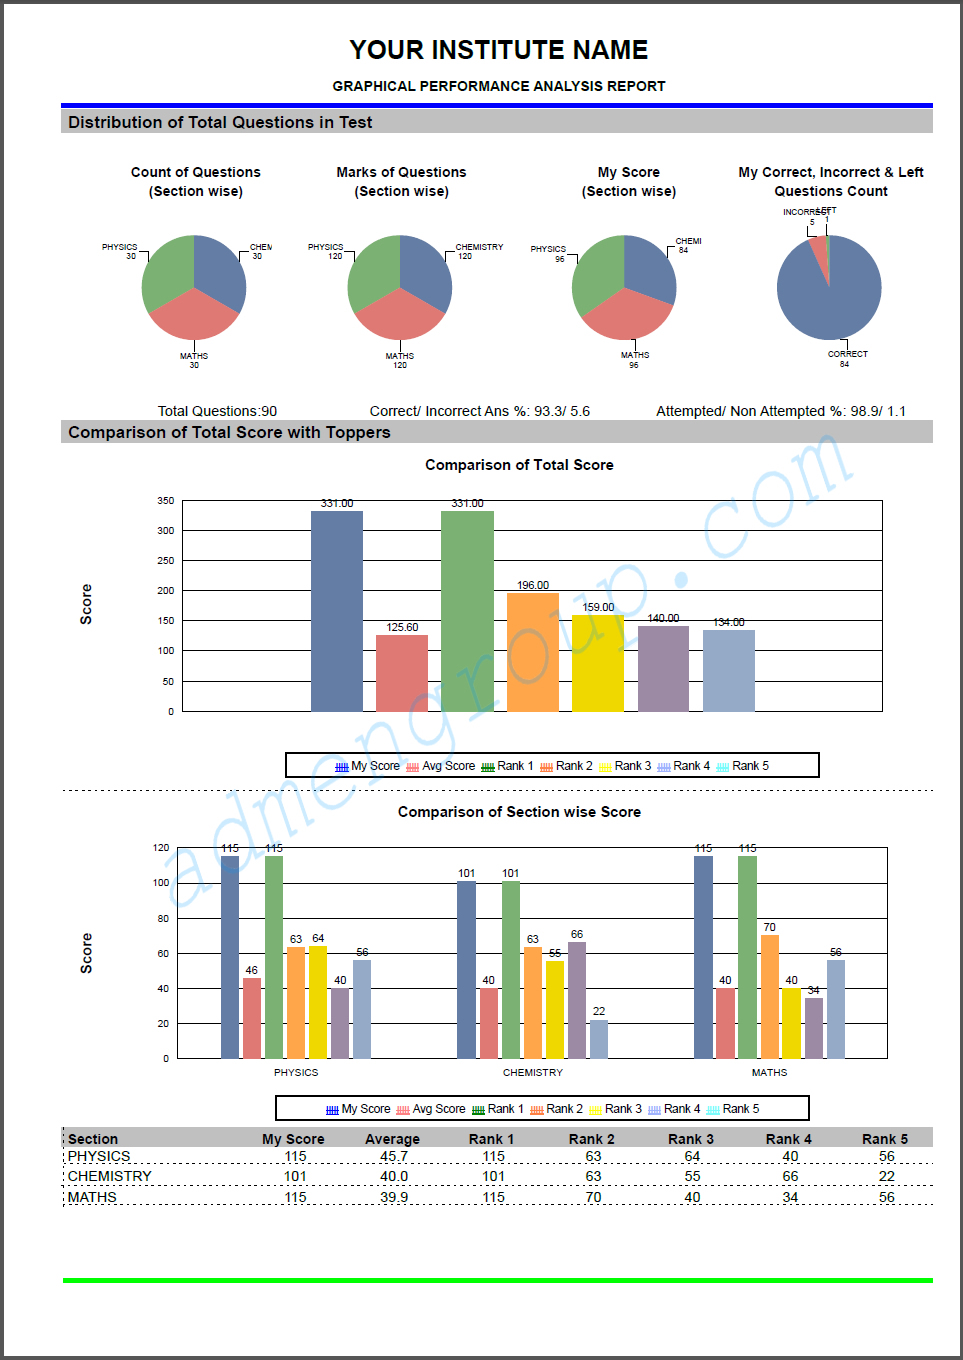
Graphical report description can be effectively used to analyse the growth of a student by comparing the test scores with the scores of the previous tests conducted.
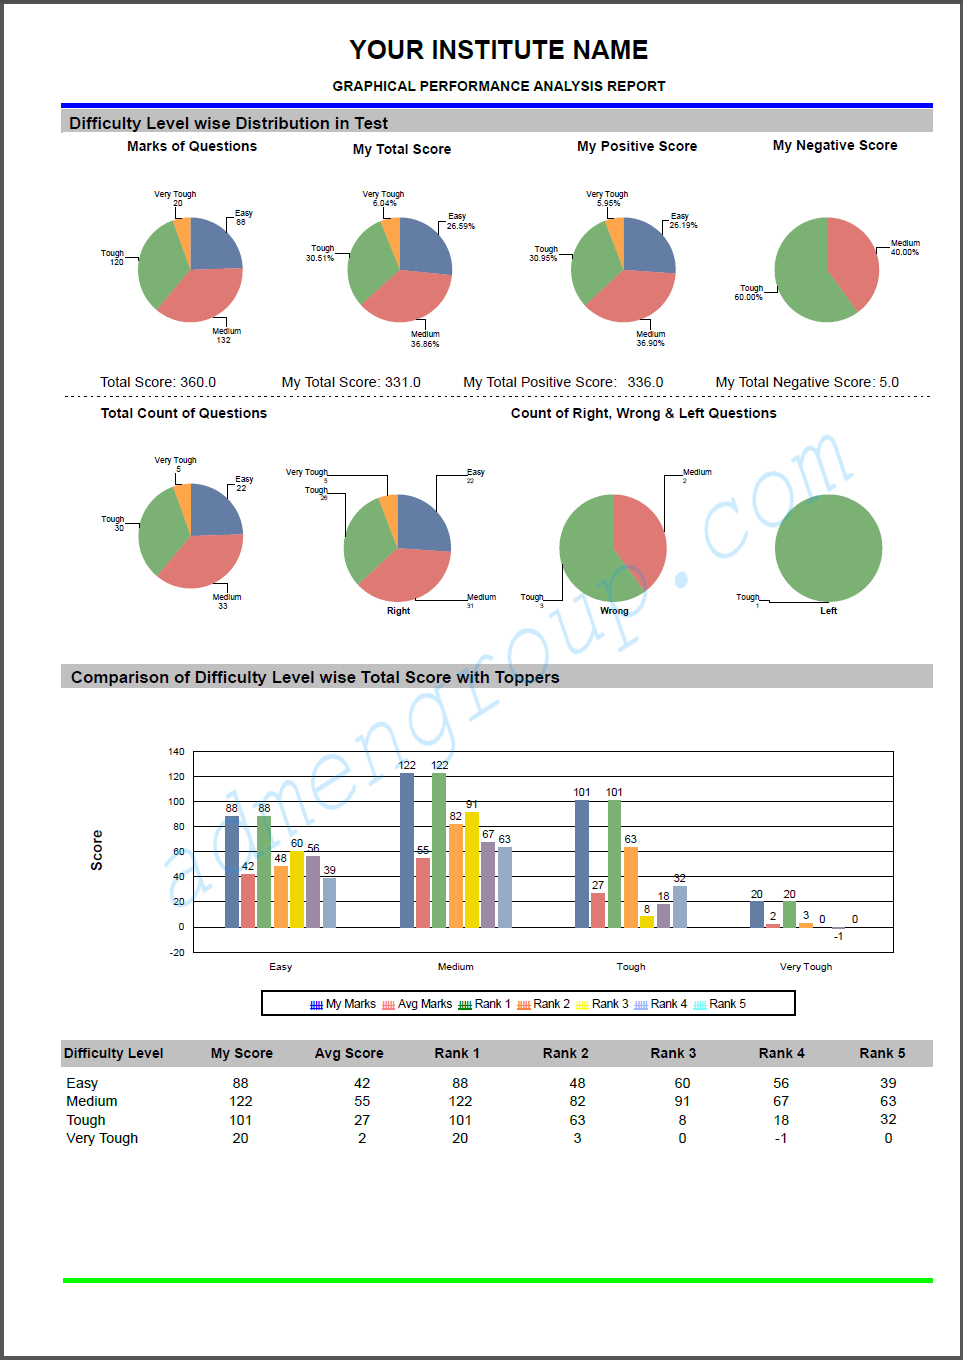
You can also evaluate the student on the basis of the scores achieved in each section of the current test and according to the difficulty level of the questions attempted and got right.
The results obtained are compared with the candidate’s individual performance, with the average score, minimum score, and the scores of the top ranking students.
The various resulting parameters are compared and plotted in form of a graph.
The overall performance of a candidate can be effectively analysed with the help of a line graph chart, which compares the current scores of a student with the past ten results or as required. It will also plot the detail with the average scorers, top scorers, and the minimum scorer among all the candidates.
When we need a result that has to note the distribution of various items in performance, we use a Pie chart. We can plot the difficulty level of questions as easy, hard, average and very difficult with the help of a pie chart.
The overall section score, individual sectional score and topic-wise performance can be easily done with help of the bar chart. The bar graph can also be used for showing topic wise score of the students as also to compare the marks with that of the toppers.
Some other graphical representations that you can show on a test analysis report include
Scores as per the difficulty level of the questions
Line graph presenting the marks of the past tests
Scores as per the number of questions attempted
Number of questions attempted in every section
Number of correct answers
Number of questions attempted, not attempted, correct and incorrect
Negative marking for each topic along with the comparing the same with that of the toppers.
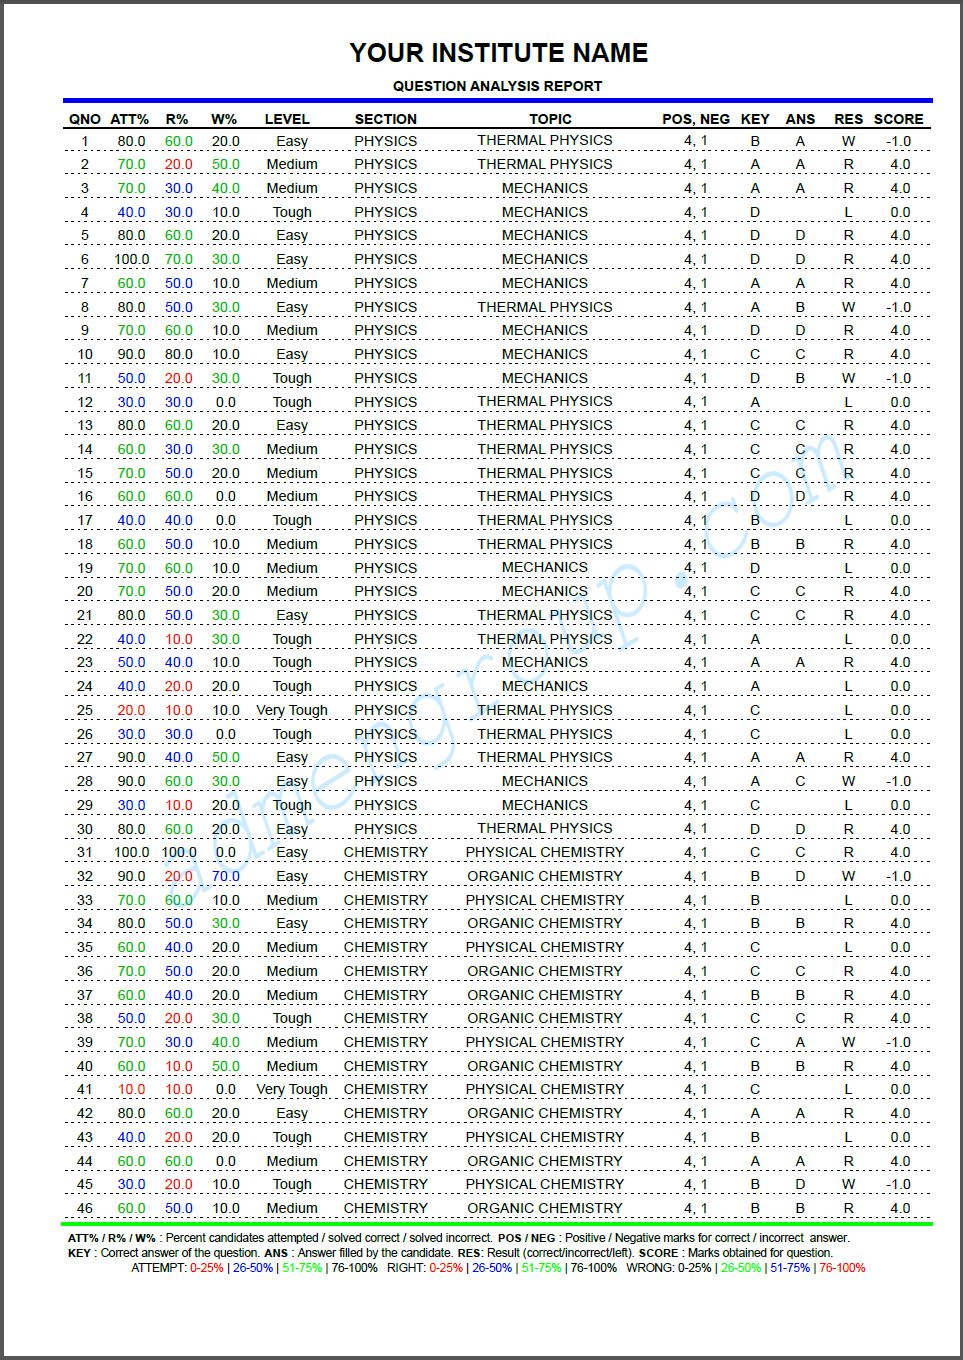
About OMR Sheets
OMR Design & Print
OMR Sheet Scanning
OMR Reading & Checking
Result & Output